Telling Complicated Stories
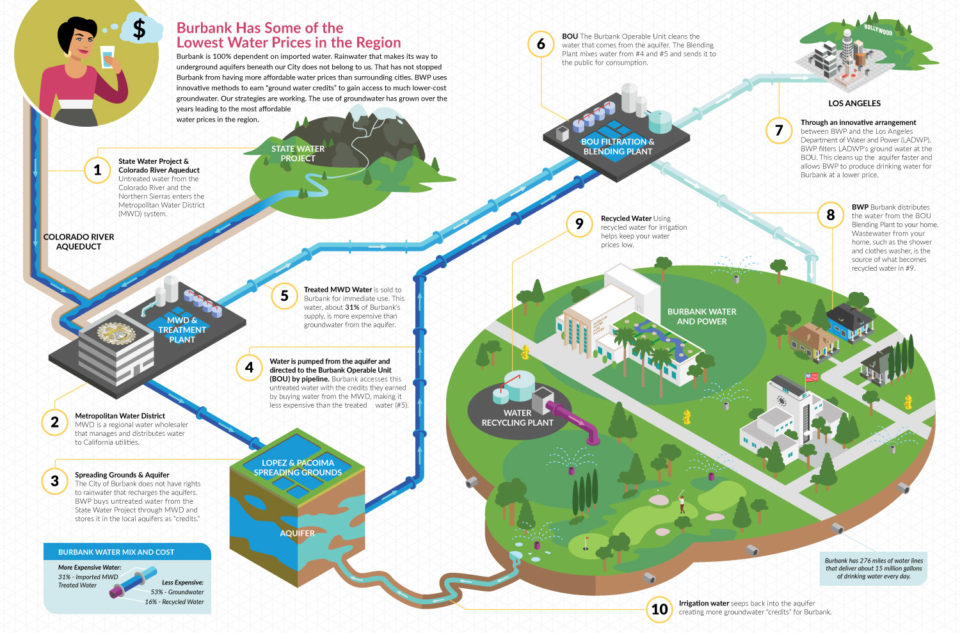
For Burbank’s Annual Water Quality Report, we were given the challenge of telling the story of how the city gets its water. This complex process had to be made into something easily digestible for the newsletter’s readers. We went through multiple rounds with a copywriter, the client, and experts to create an infographic that explained where the water comes from and how it is processed.


